Pricing Conventions, Discounting And Arbitrage

Learning Objectives
- Define discount factor and use a discount function to compute present and future values.
- Define the “law of one price,” explain it using an arbitrage argument, and describe how it can be applied to bond pricing.
- Identify arbitrage opportunities for fixed income securities with certain cash flows.
- Identify the components of a US Treasury coupon bond, and compare the structure to Treasury STRIPS, including the difference between P-STRIPS and C-STRIPS.
- Construct a replicating portfolio using multiple fixed income securities to match the cash flows of a given fixed- income security.
- Differentiate between “clean” and “dirty” bond pricing and explain the implications of accrued interest with respect to bond pricing.
- Describe the common day-count conventions used in bond pricing.
- Video Lecture
- |
- PDFs
- |
- List of chapters
Treasury Bills
- Treasury bills are instruments issued by a government to finance its short-term funding needs. They have maturity one year or less and are defined by:
- Their face value (also referred to as the principal amount or par value), and
- Their maturity date.
- The holder of a Treasury bill receives the face value on the maturity date.
| Maturity | Bid | Ask |
|---|---|---|
| March 15, 2018 | 1.345 | 1.335 |
| March 22, 2018 | 1.395 | 1.385 |
| March 29, 2018 | 1.495 | 1.485 |
| April 5, 2018 | 1.54 | 1.53 |
| April 12, 2018 | 1.568 | 1.558 |
| April 19, 2018 | 1.56 | 1.55 |
| April 26, 2018 | 1.548 | 1.538 |
| May 3, 2018 | 1.565 | 1.555 |
| May 10, 2018 | 1.603 | 1.593 |
| May 17, 2018 | 1.623 | 1.613 |
| May 24, 2018 | 1.628 | 1.618 |
| May 31, 2018 | 1.63 | 1.62 |
- This Table shows quotes for U.S. Treasury bills on March 9, 2018. The bid quote gives the price at which a market maker is prepared to buy the Treasury bill. The ask quote (sometimes also referred to as the offer quote) gives the price at which a market maker is prepared to sell the Treasury bill.
| Maturity | Bid | Ask |
|---|---|---|
| June 7, 2018 | 1.64 | 1.63 |
| June 14, 2018 | 1.648 | 1.638 |
| June 21, 2018 | 1.68 | 1.67 |
| June 28, 2018 | 1.678 | 1.668 |
| June 7, 2018 | 1.64 | 1.63 |
| June 14, 2018 | 1.648 | 1.638 |
| June 21, 2018 | 1.68 | 1.67 |
| June 28, 2018 | 1.678 | 1.668 |
| July 5, 2018 | 1.72 | 1.71 |
| July 12, 2018 | 1.73 | 1.72 |
| July 19, 2018 | 1.74 | 1.73 |
| July 26, 2018 | 1.775 | 1.765 |
| Aug. 2, 2018 | 1.803 | 1.793 |
| Aug. 9, 2018 | 1.815 | 1.805 |
| Aug. 16, 2018 | 1.823 | 1.813 |
| Aug. 23, 2018 | 1.823 | 1.813 |
| Aug. 30, 2018 | 1.828 | 1.818 |
| Sept. 6, 2018 | 1.835 | 1.825 |
| Sept. 13, 2018 | 1.813 | 1.803 |
| Oct. 11, 2018 | 1.795 | 1.785 |
| Nov. 8, 2018 | 1.813 | 1.803 |
| Dec. 6, 2018 | 1.823 | 1.813 |
| Jan. 3, 2019 | 1.9 | 1.89 |
| Jan. 31, 2019 | 1.95 | 1.94 |
| Feb. 28, 2019 | 1.97 | 1.96 |
- Define Q as the quoted price of a Treasury bill and C as the cash price. The latter is the price that would apply to a Treasury bill with a face value of USD 100. The relationship between C and Q is
- This can be rewritten as:
where
n is the number of calendar days until the maturity of the Treasury bill.
- Q is a measure of the interest earned on the Treasury bill. If n = 360 (so that the Treasury bill has 360 days to maturity), the cash price is 100 – Q . The buyer would pay 100 – Q for the Treasury bill and receive 100 in 360 days. The quote Q is the interest earned over a 360-day period as a percentage of the face value. When n<360, the interest earned over n days is scaled down so that it is Qn/360.
Treasury Bills Quote And Interest Earned
- There are two somewhat unusual aspects of this.
- The first is that Q measures the interest over a 360-day period even though most investors would choose to calculate the interest earned over a whole year.
- The second is that the interest rate is calculated as a percentage of the face value even though most investors would choose to calculate interest earned as a percentage of the amount paid for the Treasury bill.
- The interest earned over 360 days as a percentage of the amount paid is
- More generally, the interest earned over n days as a percentage of the amount paid is
- These interest rates can be adjusted so that they become interest rates per 365 days (instead of interest rates per 360 days) by multiplying them by 365/360.
Treasury Bills Quote And Cash Price
- To illustrate Treasury bill calculations, consider a Treasury bill which expires in 90 days. Assume that the bid quote is 1.640 and the ask quote is 1.630.
The bid cash price is
The ask cash price is
This indicates that the investor can sell the Treasury bill to the market maker for USD 99.5900 per USD 100 of face value and buy the Treasury bill from the market maker for USD 99.5925 per USD 100 of face value. Note that in the first case, the market maker is buying at his or her bid price, and in the second case the market maker is selling at his or her ask price. The mid-market price is the average of the bid and ask prices. In this case, it is USD 99.59125 (=0.5×(99.5900+99.5925)).
Note that while the bid quote is greater than the ask quote, the bid cash price is less than the ask cash price.
Treasury Bills Quote And Discount Factors
- The Treasury bill just considered gives a way of translating the value of cash received in 90 days to its value today. For example, USD 1 million received after 90days is worth USD 995,912.50 today. Another way of saying this is that the 90-day discount factor today is 0.9959125.
- Risk-free cash flows to be received in 90 days should be multiplied by this amount to calculate their present value.
- Calculating the future value of a cash flow is the opposite to discounting the cash flow. If USD 1,000 is owned today, the future value (based on the mid-market discount rate) is
Treasury Bonds
- While a Treasury bill lasts less than one year from the time it is issued, a Treasury bond lasts more than one year. Bonds with a maturity between one and ten years are sometimes referred to as Treasury notes, but to keep the terminology simple all coupon-bearing Treasury instruments will be referred to as Treasury bonds.
- U.S. Treasury bonds are defined by:
- The face value (also referred to as the principal amount or par value),
- The coupon rate, and
- The maturity date.
- The face value is the amount the bond holder receives on the maturity date. Coupon payments are usually made at half the coupon rate every six months. For example, if the coupon rate is 3%, USD 15 is paid per USD 1,000 of face value every six months. The coupon payment dates are the maturity date, six months before the maturity date, 12 months before the maturity date, 18 months before the maturity date, and so on. The maturity dates for Treasury bonds in the United States are usually the 15th or the end of the month.
- This Table shows quotes for some of Treasury bonds on March 9, 2018. The quotes are per USD 100 of face value. The bonds last between one week and 30 years. It can be assumed that the Treasury bonds in this Table lasting less than one year on March 9, 2018 were issued by the U.S. government some time ago with maturities exceeding one year. They are now close to maturity.
| Maturity | Coupon (%) | Bid | Ask |
|---|---|---|---|
| March 15, 2018 | 1 | 99.9922 | 100.0078 |
| April 15, 2018 | 0.75 | 99.9141 | 99.9297 |
| May 15, 2018 | 1 | 99.8906 | 99.9063 |
| May 31, 2018 | 0.875 | 99.8125 | 99.8281 |
| May 31, 2018 | 1 | 99.8359 | 99.8516 |
| May 31, 2018 | 2.375 | 100.1406 | 100.1563 |
| Aug. 15, 2018 | 4 | 100.8906 | 100.9063 |
| Sept. 15, 2018 | 1 | 99.5313 | 99.5469 |
| Oct. 15, 2018 | 0.875 | 99.3594 | 99.3750 |
| Nov. 15, 2018 | 1.25 | 99.5000 | 99.5156 |
| Dec. 15, 2018 | 1.25 | 99.4219 | 99.4375 |
| Feb. 15, 2019 | 2.75 | 100.6094 | 100.6250 |
| Aug. 15, 2019 | 0.75 | 97.9844 | 98.0000 |
| Feb. 15, 2020 | 3.625 | 102.5000 | 102.5156 |
| Feb. 15, 2020 | 8.5 | 111.8906 | 111.9063 |
| Jan. 15, 2021 | 2 | 98.8672 | 98.8828 |
| Jan. 31, 2022 | 1.5 | 96.0703 | 96.0859 |
| Jan. 31, 2023 | 1.75 | 95.8750 | 95.8906 |
| Feb. 15, 2024 | 2.75 | 100.0703 | 100.0859 |
| Jan. 31, 2025 | 2.5 | 98.0938 | 98.1094 |
| Feb. 15, 2026 | 1.625 | 91.2500 | 91.2656 |
| Feb. 15, 2027 | 2.25 | 94.9297 | 94.9453 |
| Feb. 15, 2028 | 2.75 | 98.7813 | 98.7969 |
| Feb. 15, 2029 | 5.25 | 121.7422 | 121.8047 |
| May 15, 2030 | 6.25 | 133.8828 | 133.9453 |
| Feb. 15, 2031 | 5.375 | 126.1953 | 126.2578 |
| Feb. 15, 2036 | 4.5 | 120.7813 | 120.8438 |
| Feb. 15, 2037 | 4.75 | 124.9844 | 125.0469 |
| Feb. 15, 2038 | 4.375 | 119.9219 | 119.9844 |
| Feb. 15, 2039 | 3.5 | 106.7422 | 106.8047 |
| Feb. 15, 2040 | 4.625 | 124.5391 | 124.6016 |
| Feb. 15, 2041 | 4.75 | 126.9688 | 127.0313 |
| Feb. 15, 2042 | 3.125 | 100.0938 | 100.1250 |
| Feb. 15, 2043 | 3.125 | 99.7734 | 99.8047 |
| Feb. 15, 2044 | 3.625 | 108.4141 | 108.4453 |
| Feb. 15, 2045 | 2.5 | 87.9922 | 88.0234 |
| Feb. 15, 2046 | 2.5 | 87.6719 | 87.7031 |
- As with Treasury bills, it is important to distinguish between the cash price that is paid by the purchaser for a Treasury bond and the quoted price. In the case of Treasury bonds, the cash price is the quoted price plus accrued interest. The accrued interest is the interest earned between the most recent coupon date and the settlement date. It is calculated as:
where
- c is the coupon to be paid on the next coupon date (equal to half the coupon rate applied to the face value),
- T is the number of calendar days between the last coupon date and the next coupon date, and
- t is the number of calendar days between the last coupon date and the settlement date.
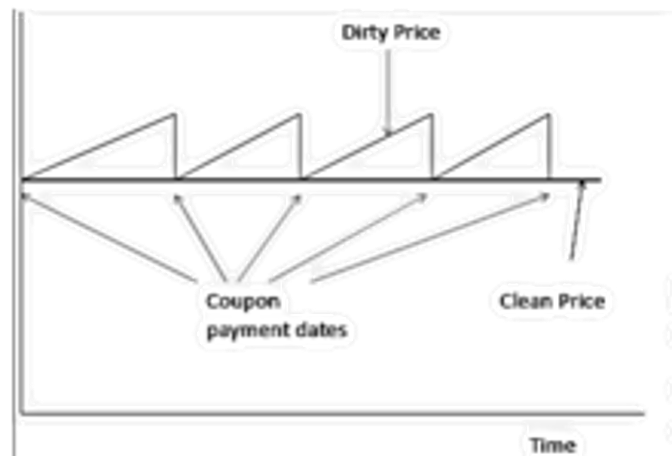
- The quoted price of the bond is referred to as the clean price and the cash price paid for the bond is referred to as the dirty price. The dirty price reflects the fact the owner of a bond has earned interest that has not yet been paid.
- Traders like to use the quoted (clean) price rather than the cash (dirty) price for quotations because it is less variable. The clean price reflects only interest rate movements, whereas the dirty price reflects both interest rate movements and the build-up of accrued interest between coupon payment dates.
- Consider a simple situation where the interest rate on Treasury securities is 3% for all maturities. A bond with a 3% coupon would be sold for its par value. If 3% continues to be the rate for all maturities, the bond will continue to sell for its par value. However, the dirty price will exhibit the pattern shown in the Figure in the next page. Immediately after a coupon payment, the clean price equals the quoted price because there is no accrued interest. As time passes from one coupon payment date to the next, accrued interest is accumulated and the dirty price increases. Then, as soon as the next coupon is paid, it drops down.
The Law Of One Price And Arbitrage
- The law of one price states that if two portfolios provide the same future cash flows, they should sell for the same price. If the law of one price did not hold, there would be theoretical arbitrage opportunities.
- To see why this is the case, suppose that:
- The price of Portfolio X is greater than the price of Portfolio Y, and
- They will provide the same cash flows at the same time in the future.
Here is an arbitrage opportunity. Consider first a trader who owns the more expensive portfolio (Portfolio X). He or she could sell Portfolio X and buy Portfolio Y for an immediate cash inflow while still receiving the same future cash flows. Consider next a trader who does not own either portfolio. This trader can simply short Portfolio X and buy Portfolio Y; the trader will lock in a profit as long as the fee for borrowing Portfolio Y is not too great.
- The existence of traders pursuing arbitrage opportunities will usually cause market prices to move until the existence of the arbitrage opportunity is eliminated. Hence, the price of Portfolio X will decline and the price of Portfolio Y will increase as traders sell Portfolio X and buy Portfolio Y; this will continue until the arbitrage profit disappears.
Replicating Bond Cash Flows
- Consider another bond maturing on February 15, 2020 having a coupon of 8.5% and a dirty (cash) price of USD 112.4855. An analyst might be interested in whether this bond is mispriced. One way of investigating this is by replicating the bond’s cash flows using other bonds.
| Bond | Cash(Dirty)Price |
|---|---|
| 4% maturing on Aug.15, 2018 | 101.1747 |
| 2.75% maturing on Feb.15, 2019 | 100.8071 |
| 0.75% maturing on Aug.15, 2019 | 98.0440 |
| 3.625% maturing on Feb.15, 2020 | 102.7581 |
- Note that determining discount factors from coupon-bearing bonds involves starting with the shortest maturity bond and looking at progressively longer maturity bonds. Replicating the cash flows of a bond in the way that has just been described involves the reverse; starting by replicating the longest maturity cash flow and work backwards.
Replicating Bond Cash Flows – FRM Sample Question
- You have been asked to check for arbitrage opportunities in the Treasury bond market by comparing the cash flows of selected bonds with the cash flows of combinations of other bonds. If a 1-year zero-coupon bond is priced at USD 96.12 and 1-year bond paying a 10% coupon semi-annually is priced at USD 106.20, what should be the price of a 1-year Treasury bond that pays a coupon of 8% semi-annually ?
A. USD 98.10
B. USD 101.23
C. USD 103.35
D. USD 104.18
STRIPS
- STRIPS is an acronym for Separate Trading of Registered Interest and Principal of Securities. STRIPS are created by investment dealers when a coupon-bearing bond is delivered to the Treasury and exchanged for its principal and coupon components. The securities created from the coupon payments are known as TINTs, INTs, or C-STRIPS. The securities created from principal payments are known as TPs, Ps, or P-STRIPS.
- Consider the May 15, 2030 bond paying a coupon of 6.25% in the earlier Table. A bond with a face value of USD 1,000,000 provides a coupon of USD 31,250 every May 15 and November 15 and a final principal payment of USD 1,000,000. This would be converted into 25 C-STRIPS and one P-STRIP as indicated in Table in the next page.
| Date | C-STRIP Face Value (USD) | P-STRIP Face Value (USD) |
|---|---|---|
| May 15, 2018 | 31,250 | |
| November 15, 2018 | 31,250 | |
| May 15, 2019 | 31,250 | |
| November 15, 2019 | 31,250 | |
| …. | ||
| November 15, 2029 | 31,250 | |
| May 15, 2030 | 31,250 | 1,000,000 |
| Maturity | P-STRIPS | |
|---|---|---|
| Bid | Ask | |
| May 15, 2020 | 95.367 | 95.387 |
| May 15, 2021 | 92.499 | 92.528 |
| Nov 15, 2022 | 88.634 | 88.675 |
| Aug 15, 2023 | 86.497 | 86.544 |
| Nov 15, 2024 | 83.143 | 83.197 |
| Aug 15, 2025 | 81.216 | 81.275 |
| Nov 15, 2026 | 78.089 | 78.156 |
| Nov 15, 2027 | 75.612 | 75.684 |
| Nov 15, 2028 | 73.271 | 73.348 |
| Aug 15, 2029 | 71.675 | 71.756 |
| May 15, 2030 | 70.100 | 70.184 |
| Maturity | Bid | Ask |
|---|---|---|
| P-STRIPS | ||
| May 15, 2020 | 95.367 | 95.387 |
| May 15, 2021 | 92.499 | 92.528 |
| Nov 15, 2022 | 88.634 | 88.675 |
| Aug 15, 2023 | 86.497 | 86.544 |
| Nov 15, 2024 | 83.143 | 83.197 |
| Aug 15, 2025 | 81.216 | 81.275 |
| Nov 15, 2026 | 78.089 | 78.156 |
| Nov 15, 2027 | 75.612 | 75.684 |
| Nov 15, 2028 | 73.271 | 73.348 |
| Aug 15, 2029 | 71.675 | 71.756 |
| May 15, 2030 | 70.100 | 70.184 |
- This Table gives a sample of some P-STRIP prices on March 9, 2018. The prices provide direct estimates of discount rates.
- This Table gives a sample of some C-STRIP prices on March 9, 2018. Just like P-STRIP prices, these prices also provide direct estimates of discount rates.
| Maturity | Bid | Ask |
|---|---|---|
| C-STRIPS | ||
| May 15, 2020 | 95.238 | 95.259 |
| May 15, 2021 | 92.397 | 92.426 |
- The table shows that (in theory) there were some arbitrage opportunities available on March 9, 2018. For example, one could buy the May 15, 2021 C-STRIP for USD 92.426 and short the May 15, 2021 P-STRIP for USD 92.499. However, transactions costs would probably eliminate any gains from this position.
ADVANTAGES:
- They can be easily used to create any type of cash flow stream and hence asset cash flows can be matched with liability cash flows to fund a number of liabilities, for example, to provide for college expenses. This also reduces reinvestment risk.
DISADVANTAGES:
- They can be illiquid.
- They are quite sensitive to interest rate changes than are coupon bonds. This can be an issue for hedging purposes.
- Shorter-term C-STRIPS generally trade rich and longer-term C-STRIPS generally trade cheap, where as P-STRIPS generally trade at fair value.
- STRIP mispricing can be used by large institutions to collect profits. This is done by either buying Treasuries and stripping them or reconstituting STRIPS. Since there are costs involved with stripping and reconstituting, investors end up paying a premium for zero-coupon bonds.
Go to Syllabus
Courses Offered
Popular Courses
FRM Part 1
FRM Part 2

By : Micky Midha
9 Hrs of Videos
Available On Web, IOS & Android
Access Until You Pass
Lecture PDFs
Class Notes

By : Micky Midha
12 Hrs of Videos
Available On Web, IOS & Android
Access Until You Pass
Lecture PDFs
Class Notes

By : Micky Midha
257 Hrs Of Videos
Available On Web, IOS & Android
Access Until You Pass
Complete Study Material
Quizzes,Question Bank & Mock tests

By : Micky Midha
240 Hrs Of Videos
Available On Web, IOS & Android
Access Until You Pass
Complete Study Material
Quizzes,Question Bank & Mock tests

By : Shubham Swaraj
Lecture Videos
Available On Web, IOS & Android
Complete Study Material
Question Bank & Lecture PDFs
Doubt-Solving Forum